.png)
||
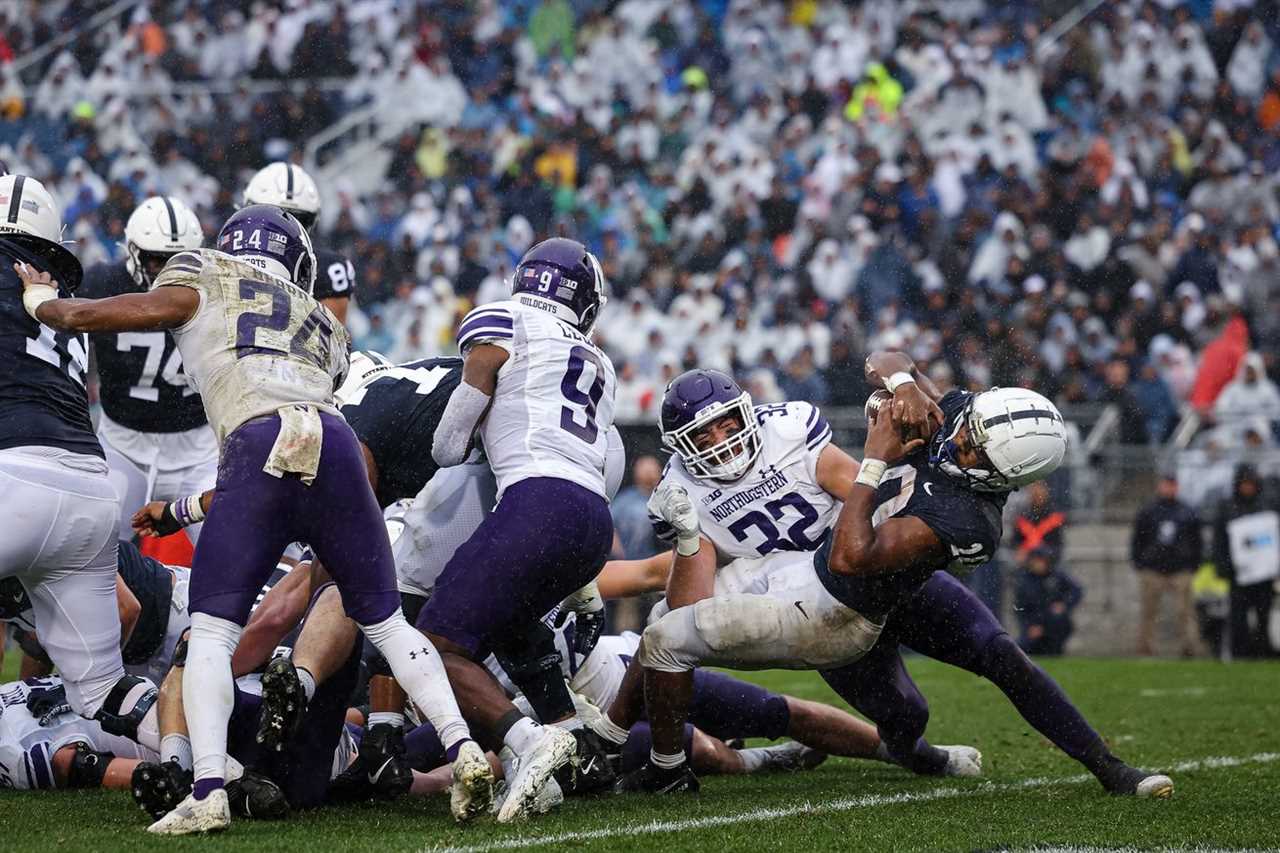
The Nittany Lions travel to Evanston to take on a Wildcat team fresh off a surprising upset of Minnesota.
No. 6 Penn St. Nittany Lions (4-0; 2-0 Big Ten East) vs Northwestern Wildcats (2-2; 1-1 Big Ten West)
12:00 p.m. ET, September 30, 2023—Big Ten Network
Stadium (Capacity: 47,130 / Evanston, IL)
| Penn State | Value (Nat'l Rank) | Value (Nat'l Rank) | Northwestern | Advantage |
|---|---|---|---|---|
| Rushing Offense (ypg) | 210.0 (17) | 184.5 (112) | Rushing Defense (ypg) | [TAG1][TAG1] [TAG1] |
| Passing Offense (ypg) | 239.8 (T - 65) | 187.5 (33) | Passing Defense (ypg) | [TAG4] |
| Pass Efficiency | 147.5 (44) | 137.96 (80) | Pass Efficiency Defense | [TAG1] |
| Total Offense (ypg) | 449.8 (33) | 372.0 (76) | Total Defense (ypg) | [TAG1] |
| Scoring Offense (ppg) | 40.5 (15) | 25.75 (T - 76) | Scoring Defense (ppg) | [TAG1] [TAG1] |
| Rushing Defense (ypg) | 81.5 (13) | 98.0 (119) | Rushing Offense (ypg) | [TAG1] [TAG1] [TAG1] [TAG1] |
| Passing Defense (ypg) | 138.0 (1) | 239.8 (T - 65) | Passing Offense (ypg) | [TAG1] [TAG1] |
| Pass Efficiency Defense | 88.26 (1) | 127.6 (84) | Pass Efficiency | [TAG1] [TAG1] [TAG1] |
| Total Defense (ypg) | 219.5 (1) | 337.8 (100) | Total Offense (ypg) | [TAG1] [TAG1] [TAG1] |
| Scoring Defense (ppg) | 8.75 (4) | 24.0 (T - 88) | Scoring Offense (ppg) | [TAG1] [TAG1] [TAG1] |
| Punt Return Defense (ypr) | 7.29 (T - 73) | -3.0 (130) | Punt Return Yds (ypr) | [TAG1] [TAG1] |
| Punt Return Yds (ypr) | 3.73 (T - 108) | 2.0 (T - 24) | Punt Return Defense (ypr) | [TAG4] [TAG4] [TAG4] |
| Net Punting Yds (ypp) | 37.29 (95) | 36.91 (T - 99) | Net Punting Yds (ypp) | Push |
| Kickoff Return Yds (ypr) | 19.8 (63) | 17.0 (T - 42) | Kickoff Return Defense (ypr) | Push |
| Kickoff Return Defense (ypr) | 13.6 (13) | 23.8 (26) | Kickoff Return Yds (ypr) | Push |
| Turnover Margin (season) | +2.75 (1) | +0.00 (67) | Turnover Margin (season) | [TAG1] [TAG1] |
| Passes Had Intercepted (season) | 0 (T - 1) | 3 (T - 67) | Passes Intercepted (season) | [TAG1] [TAG1] |
| Passes Intercepted (season) | 5 (T - 26) | 3 (T - 41) | Passes Had Intercepted (season) | Push |
| Penalty Yds/Game | 43.75 (39) | 39.5 (28) | Penalty Yds/Game | Push |
| Sacks (spg) | 3.25 (T - 18) | 2.75 (103) | Sacks Allowed (spg) | [TAG1] [TAG1] [TAG1] |
| Sacks Allowed (spg) | 0.5 (T - 4) | 1.5 (T - 105) | Sacks (spg) | [TAG1] [TAG1] [TAG1] [TAG1] |
| Tackles for Loss (tpg) | 6.2 (T - 48) | 6.0 (T - 74) | Tackles for Loss Allowed (tpg) | [TAG1] |
| Tackles for Loss Allowed (tpg) | 4.25 (T - 30) | 5.0 (T - 94) | Tackles for Loss (tpg) | [TAG1] [TAG1] |
| Redzone Offense (% season) | 91.3% (T - 28) | 86.7% (T - 90) | Redzone Defense (% season) | [TAG1] [TAG1] |
| Redzone Defense (% season) | 100.0% (T - 120) | 91.7% (T - 25) | Redzone Offense (% season) | [TAG4] [TAG4] [TAG4] |
| Redzone TD % (season) | 78.26% | 73.33% | Redzone TD % Defense (season) | Push |
| Redzone TD % Defense (season) | 75.0% | 83.3% | Redzone TD % (season) | [TAG1] |
| 3rd Down Conv. % (season) | 44.3% (51) | 35.8% (43) | 3rd Down Defense % (season) | Push |
| 3rd Down Defense % (season) | 24.5% (5) | 47.5% (T - 29) | 3rd Down Conv. % (season) | Push |
| 4th Down Conv. % (season) | 88.9% (T - 5) | 66.7% (T - 101) | 4th Down Defense % (season) | [TAG1] [TAG1] [TAG1] |
| 4th Down Defense % (season) | 62.5% (T - 95) | 33.3% (T - 103) | 4th Down Conv. % | Push |
| 1st Downs | 109 (T - 5) | 78 (T - 72) | 1st Downs Allowed | [TAG1] [TAG1] |
| 1st Downs Allowed | 46 (T - 1) | 75 (T - 94) | 1st Downs | [TAG1] [TAG1] [TAG1] |
| Time of Possession | 37 (1) | 25 (124) | Time of Possession | [TAG1] [TAG1] [TAG1] [TAG1] |
| Strength of Schedule | 31 | 25 | Strength of Schedule | Push |
Difference >25 in National Rank = [TAG1]
Difference >50 in National Rank = [TAG1][TAG1]
Note:
All of the above rankings are taken directly from the NCAA except for strength of schedule, which is taken from Power Rankings.
The Redzone TD% and Redzone TD% Defense are calculated by me and not ranked by the NCAA. Determining who has the advantage in these categories is strictly my arbitrary judgment.
Quick thoughts:
Boy, a white out blanking of Iowa will sure do good things to your rankings, as the Nittany Lions now lead the nation in a whopping seven different statistical categories.
One of the things that didn’t change in these numbers? The defensive red zone figures - because Iowa didn’t get into the red zone at all last week. Woof.
Some other thoughts:
- Northwestern’s opponents have only returned two punts to our opponents’ seven
- Penn State has returned eleven punts, while the Wildcats have only returned one
- Iowa returned no kickoffs last week (despite Gabriel Nwosu seemingly having been instructed into baiting them into returning them); overall, PSU opponents have returned six kickoffs. Northwestern’s opponents have returned 5
- The Nittany Lions have still only returned 5 kick offs, as Iowa only kicked off one time last week
- Northwestern’s opponents have been in the red zone 15 times, compared to the whopping FOUR times through four games that PSU opponents started inside the Nittany Lion 20
- Penn State has been in the red zone 23 times, almost double the RZ trips of the Wildcats (12 times)
- After going 3 for 3 last week, PSU is 8 of 9 on fourth downs on the year; NW is 2 of 6.
What say you all?
||--------------------------------
By: Cari Greene
Title: Just the Stats: No. 6 Penn State at Northwestern
Sourced From: www.blackshoediaries.com/2023/9/27/23890092/penn-state-football-just-the-stats-no-6-at-northwestern-chipmunks-elite-defense-road-big-ten
Published Date: Wed, 27 Sep 2023 14:14:00 +0000