.png)
scroll down for a surprise!
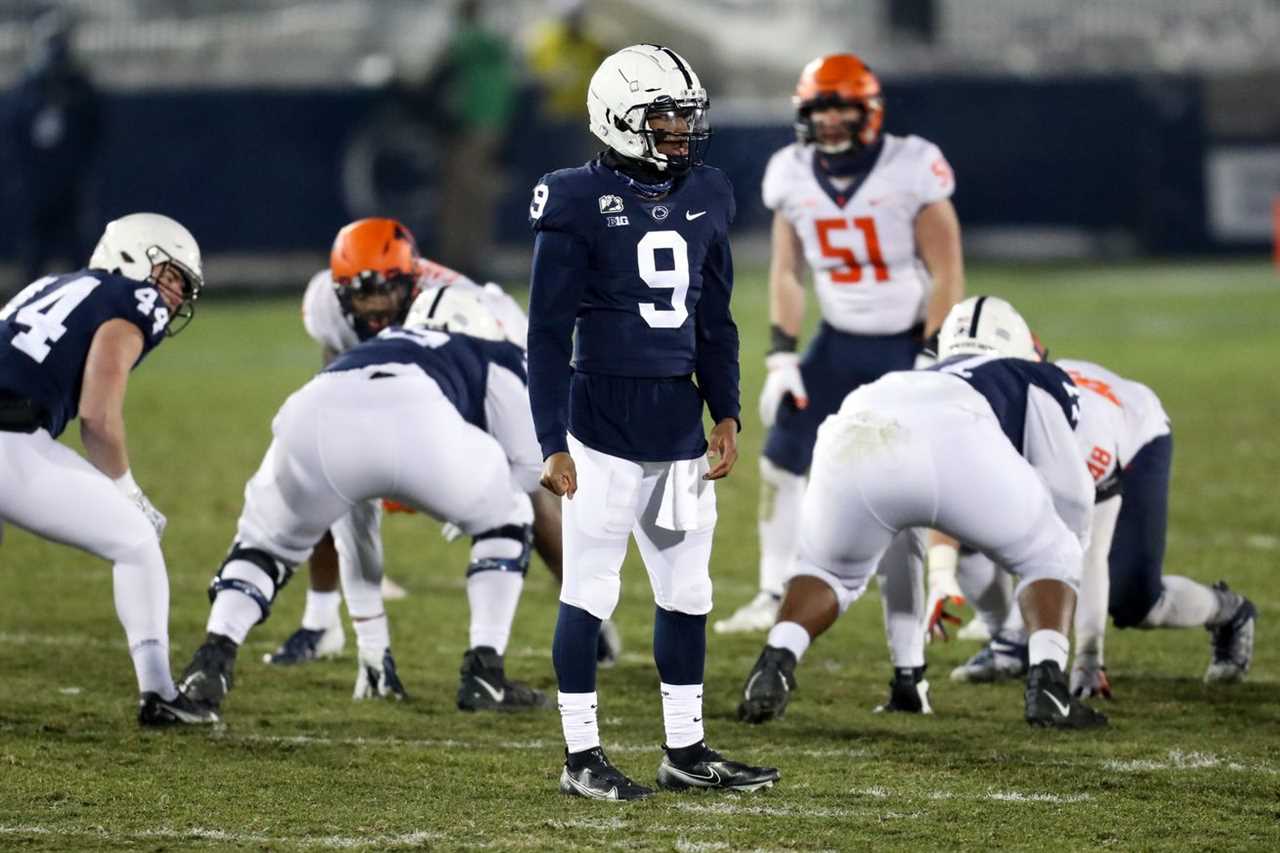
#7 Penn St. Nittany Lions (5-1; 2-1 Big Ten East) vs Illinois Fighting Illini (2-5; 1-3 Big Ten West)
12 p.m. ET, October 23, 2021--ABC
Beaver Stadium (Capacity: 106,579 / University Park, PA)
| Penn State | Value (Nat'l Rank) | Value (Nat'l Rank) | Illinois | Advantage |
|---|---|---|---|---|
| Rushing Offense (ypg) | 128.3 (95) | 163.1 (87) | Rushing Defense (ypg) | Push |
| Passing Offense (ypg) | 268.3 (35) | 264.7 (107) | Passing Defense (ypg) |
|
| Pass Efficiency | 140.31 (59) | 143.65 (97) | Pass Efficiency Defense |
|
| Total Offense (ypg) | 396.7 (65) | 427.9 (101) | Total Defense (ypg) |
|
| Scoring Offense (ppg) | 28.3 (T - 68) | 24.57 (65) | Scoring Defense (ppg) | Push |
| Rushing Defense (ypg) | 111.3 (26) | 164.7 (67) | Rushing Offense (ypg) |
|
| Passing Defense (ypg) | 201.3 (31) | 153.7 (122) | Passing Offense (ypg) |
|
| Pass Efficiency Defense | 102.12 (4) | 101.17 (127) | Pass Efficiency |
|
| Total Defense (ypg) | 312.7 (23) | 318.4 (117) | Total Offense (ypg) |
|
| Scoring Defense (ppg) | 13.83 (4) | 17.7 (120) | Scoring Offense (ppg) |
|
| Punt Return Defense (ypr) | 3.67 (26) | 5.0 (T - 96) | Punt Return Yds | |
| Punt Return Yds | 6.64 (76) | 2.92 (T - 17) | Punt Return Defense (ypr) |
|
| Net Punting Yds | 45.97 (3) | 44.1 (8) | Net Punting Yds | Push |
| Kickoff Return Yds | 16.86 (112) | 15.0 (T - 7) | Kickoff Return Defense |
|
| Kickoff Return Defense | 0.0 (1) | 16.33 (116) | Kickoff Return Yds |
|
| Turnover Margin | +.50 (39) | +1.14 (9) | Turnover Margin |
|
| Passes Had Intercepted | 7 (T - 93) | 5 (T - 64) | Passes Intercepted | |
| Passes Intercepted | 8 (T - 13) | 2 (T - 9) | Passes Had Intercepted | Push |
| Penalty Yds/Game | 50.33 (56) | 47.14 (T - 41) | Penalty Yds/Game | Push |
| Sacks | 1.83 (T - 92) | 2.14 (T - 66) | Sacks Allowed | |
| Sacks Allowed | 1.5 (T - 28) | 2.14 (T - 70) | Sacks | |
| Tackles for Loss (tpg) | 6.3 (T - 36) | 6.14 (T - 93) | Tackles for Loss Allowed (tpg) |
|
| Tackles for Loss Allowed (tpg) | 6.5 (T - 100) | 4.6 (101) | Tackles for Loss (tpg) | Push |
| Redzone Offense (%) | 90.0% (T - 28) | 82.1% (67) | Redzone Defense (%) | |
| Redzone Defense (%) | 57.9% (2) | 62.5% (128) | Redzone Offense (%) |
|
| Redzone TD % | 60.0% | 50.0% | Redzone TD % Defense | |
| Redzone TD % Defense | 31.58% | 37.5% | Redzone TD % |
|
| 3rd Down Conv. % | 35.0% (T - 97) | 43.7% (104) | 3rd Down Defense % | Push |
| 3rd Down Defense % | 34.3% (34) | 38.9% (T - 76) | 3rd Down Conv. % | |
| 4th Down Conv. % | 36.4% (T - 111) | 80.0% (126) | 4th Down Defense % | Push |
| 4th Down Defense % | 60.0% (T - 81) | 40.0% (T - 103) | 4th Down Conv. % | Push |
| 1st Downs | 123 (T - 91) | 164 (T - 123) | 1st Downs Allowed | |
| 1st Downs Allowed | 118 (42) | 129 (T - 79) | 1st Downs | |
| Time of Possession | 27 (108) | 29 (64) | Time of Possession | |
| Strength of Schedule | 9 | 41 | Strength of Schedule |
Difference >25 in National Rank = ![]()
Difference >50 in National Rank = ![]()
![]()
Difference >75 in National Rank = ![]()
![]()
![]()
Difference >100 in National Rank =![]()
![]()
![]()
![]()
Note:
All of the above rankings are taken directly from the NCAA except for strength of schedule, which is taken from Team Rankings.com.
The Redzone TD% and Redzone TD% Defense are calculated by me and not ranked by the NCAA. Determining who has the advantage in these categories is strictly my arbitrary judgment.
Quick thoughts:
I have one overarching thought which is that if there is one game on our schedule where we’re ok having a backup QB start, it’s this one. Woof, Illinois - starting off the season at a high note in beating Nebraska, and at the midpoint your coach is publicly writing off three years’ worth of players as not worthy of playing for your team. The numbers bare that out, especially this one:

I’ve been doing this column for a number of years now, and I don’t think I’ve ever seen five chipmunks! The red zone will be our friend in this game - our offense has been in the redzone 20 times, coming out with 12 TDs and 6 field goals; Illinois’ defense has allowed 28 redzone trips, resulting in 14 TDs and 9 field goals. On the flip (even more amazing, as shown above) side, Illinois’ offense has been in the redzone just 16 times in 7 games (2.3 times per game) and come out with a total of 6 TDs and 4 field goals - less than 1 td per game. Going up against a defense that’s allowed 19 redzone trips but only 6 touchdowns and 5 field goals, that’s a recipe for some fun if you’re a Penn Stater.
This, and the amazing defense that Brent Pry has put together this year, is why it’s going to be ok this week, whether Ta’quan Roberson or Christian Veilleux starts this week.
Once again...

--------------------------------
By: Cari Greene
Title: Just the Stats: No. 7 Penn State vs Illinois
Sourced From: www.blackshoediaries.com/2021/10/20/22735544/penn-state-football-just-the-stats-no-7-vs-illinois-defense-pass-efficiency-red-zone-backup-score
Published Date: Wed, 20 Oct 2021 20:53:00 +0000