.png)
||
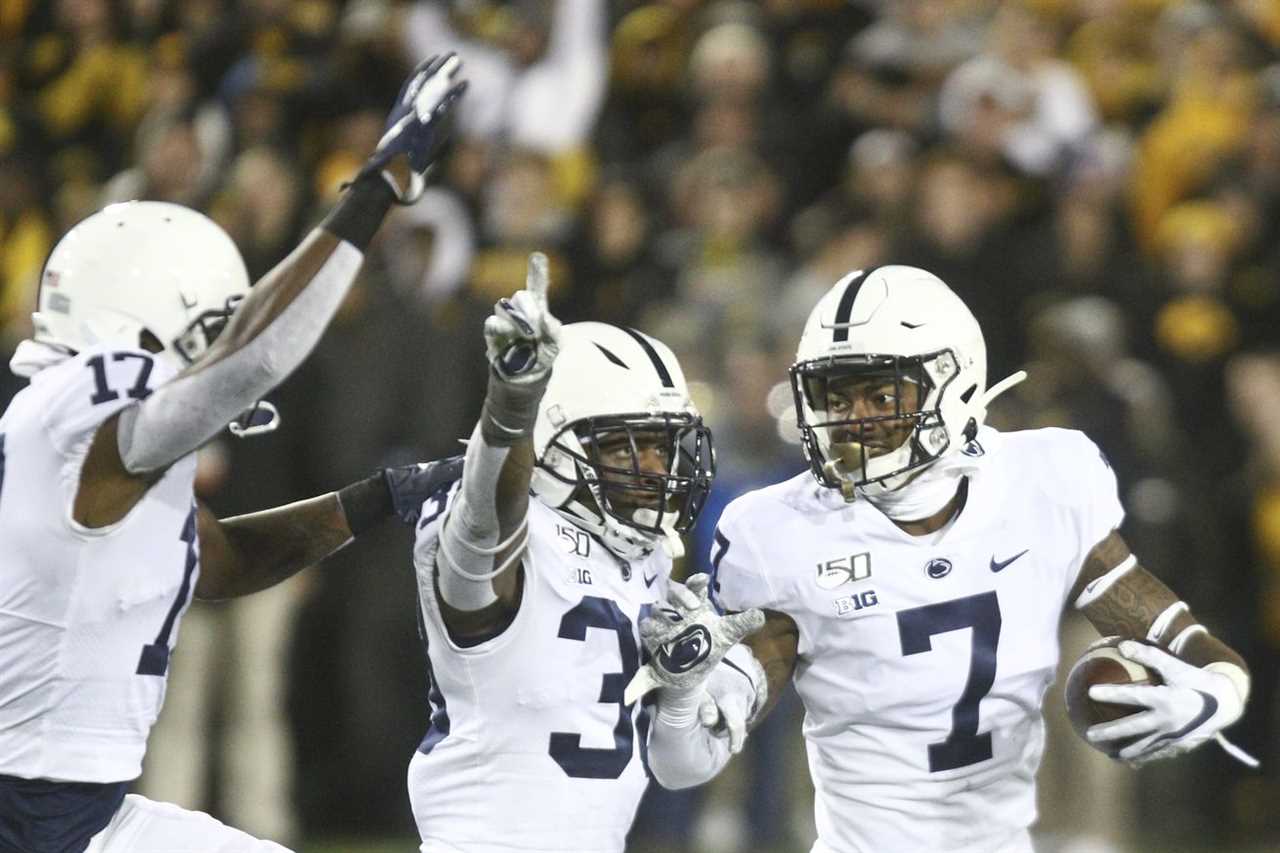
All the rankings behind this week’s white out matchup between ranked opponents.
No. 7 Penn St. Nittany Lions (3-0; 1-0 Big Ten East) vs No. 24 Iowa Hawkeyes (3-0; 0-0 Big Ten West)
7:30 p.m. ET, September 23, 2023—CBS
Beaver Stadium (Capacity: 106,572 / University Park, PA)
| Penn State | Value (Nat'l Rank) | Value (Nat'l Rank) | Iowa | Advantage |
|---|---|---|---|---|
| Rushing Offense (ypg) | 208.3 (22) | 106.7 (40) | Rushing Defense (ypg) | Push |
| Passing Offense (ypg) | 259.0 (50) | 179.3 (32) | Passing Defense (ypg) | Push |
| Pass Efficiency | 152.11 (47) | 102.81 (17) | Pass Efficiency Defense | [TAG1] |
| Total Offense (ypg) | 467.3 (26) | 286.0 (31) | Total Defense (ypg) | Push |
| Scoring Offense (ppg) | 43.7 (14) | 12.33 (T - 18) | Scoring Defense (ppg) | Push |
| Rushing Defense (ypg) | 96.7 (33) | 151.3 (T - 72) | Rushing Offense (ypg) | [TAG2] |
| Passing Defense (ypg) | 170.7 (21) | 150.7 (121) | Passing Offense (ypg) | [TAG2] [TAG2] [TAG2] [TAG2] |
| Pass Efficiency Defense | 94.67 (11) | 111.91 (114) | Pass Efficiency | [TAG2] [TAG2] [TAG2] [TAG2] |
| Total Defense (ypg) | 267.3 (16) | 302.0 (T - 119) | Total Offense (ypg) | [TAG2] [TAG2] [TAG2] [TAG2] |
| Scoring Defense (ppg) | 11.67 (13) | 28.3 (T - 73) | Scoring Offense (ppg) | [TAG2] [TAG2] |
| Punt Return Defense (ypr) | 9.0 (T - 83) | 8.5 (T - 52) | Punt Return Yds | [TAG1] |
| Punt Return Yds | 6.57 (T - 74) | 3.6 (48) | Punt Return Defense (ypr) | [TAG1] |
| Net Punting Yds | 38.45 (77) | 43.29 (13) | Net Punting Yds | [TAG1] [TAG1] |
| Kickoff Return Yds | 19.8 (65) | 0.0 (T - 2) | Kickoff Return Defense | [TAG1] [TAG1] |
| Kickoff Return Defense | 13.6 (15) | 30.0 (14) | Kickoff Return Yds | Push |
| Turnover Margin | +2.33 (3) | +0.0 (T - 58) | Turnover Margin | [TAG2] [TAG2] |
| Passes Had Intercepted | 0 (T - 1) | 2 (T - 68) | Passes Intercepted | [TAG2] [TAG2] |
| Passes Intercepted | 5 (T - 11) | 3 (T - 70) | Passes Had Intercepted | [TAG2] [TAG2] |
| Penalty Yds/Game | 43.33 (40) | 18.33 (1) | Penalty Yds/Game | [TAG1] |
| Sacks | 3.33 (T - 16) | 2.0 (T - 69) | Sacks Allowed | [TAG2] [TAG2] |
| Sacks Allowed | 0.67(T - 12) | 1.0 (T - 118) | Sacks | [TAG2] [TAG2] [TAG2] [TAG2] |
| Tackles for Loss (tpg) | 6.7 (T - 35) | 6.67 (T - 96) | Tackles for Loss Allowed (tpg) | [TAG2] [TAG2] |
| Tackles for Loss Allowed (tpg) | 3.67 (T - 12) | 4.7 (T - 102) | Tackles for Loss (tpg) | [TAG2] [TAG2] [TAG2] |
| Redzone Offense (%) | 94.4% (20) | 66.67% (T - 19) | Redzone Defense (%) | Push |
| Redzone Defense (%) | 100.0% (T - 109) | 91.7% (T - 31) | Redzone Offense (%) | [TAG1] [TAG1] [TAG1] |
| Redzone TD % | 77.78% | 33.33% | Redzone TD % Defense | Push |
| Redzone TD % Defense | 75.0% | 58.33% | Redzone TD % | [TAG2] |
| 3rd Down Conv. % | 43.9% (59) | 33.3% (T - 38) | 3rd Down Defense % | Push |
| 3rd Down Defense % | 30.0% (T - 18) | 34.9% (T - 107) | 3rd Down Conv. % | [TAG2] [TAG2] [TAG2] |
| 4th Down Conv. % | 80.0% (T - 19) | 33.3% (T - 38) | 4th Down Defense % | Push |
| 4th Down Defense % | 57.1% (T - 85) | 66.67% (T - 36) | 4th Down Conv. % | [TAG1] |
| 1st Downs | 81 (T - 14) | 46 (T - 21) | 1st Downs Allowed | Push |
| 1st Downs Allowed | 42 (T - 11) | 46 (T - 121) | 1st Downs | [TAG2] [TAG2] [TAG2] [TAG2] |
| Time of Possession | 34 (7) | 30 (53) | Time of Possession | [TAG2] |
| Strength of Schedule | 55 | 67 | Strength of Schedule | Push |
Difference >25 in National Rank = [TAG2]
Difference >50 in National Rank = [TAG2][TAG2]
Note:
All of the above rankings are taken directly from the NCAA except for strength of schedule, which is taken from Power Rankings.
The Redzone TD% and Redzone TD% Defense are calculated by me and not ranked by the NCAA. Determining who has the advantage in these categories is strictly my arbitrary judgment.
Quick thoughts:
Don’t lie - this is about what you’d expect.
Iowa’s offense under Brian Ferentz has been notoriously conservative, and these numbers tell that story. Kirk Ferentz wants to win games by playing stout defense and solid special teams, and despite vaunted Michigan transfer Cade MacNamara, that’s exactly what the Hawkeyes have done this year. So it’s no surprise that they have an edge in special teams - and Penn State has a DECIDED edge when the Nittany Lions defense matches up against Iowa’s offense.
The stats are pretty balanced when Drew Allar and the PSU offense take the field, rankings that dropped somewhat after a lackluster performance on the road in a snoozer in Champaign last week. Nothing that a white out can’t fix, right?
Some key numbers behind these statistics:
- Iowa has returned ten punts to Penn State’s 7 through three games
- The Hawkeyes have had only five punts returned, to the Nittany Lions’ opponents returning four
- None of UI’s kickoffs have been returned
- Five of PSU’s kickoffs have been attempted to be returned, most of which were returned from inside the endzone
- Iowa has been called for 8 penalties total through three games
- Penn State has been called for 15 penalties total through three games - seven of which were called in the Illinois game alone
- The Nittany Lions offense has been in the red zone 18 times; Iowa’s offense has been in the red zone 12 times
- Iowa opponents have been in the red zone only 6 times through three games - but Penn State’s opponents have only been in the red zone 4 times
What say you all?
||--------------------------------
By: Cari Greene
Title: Just the Stats: No. 7 Penn State vs No. 24 Iowa
Sourced From: www.blackshoediaries.com/2023/9/20/23881437/penn-state-football-just-the-stats-no-7-vs-24-iowa-is-punting-winning-25-points-offense-conservative
Published Date: Wed, 20 Sep 2023 14:42:00 +0000